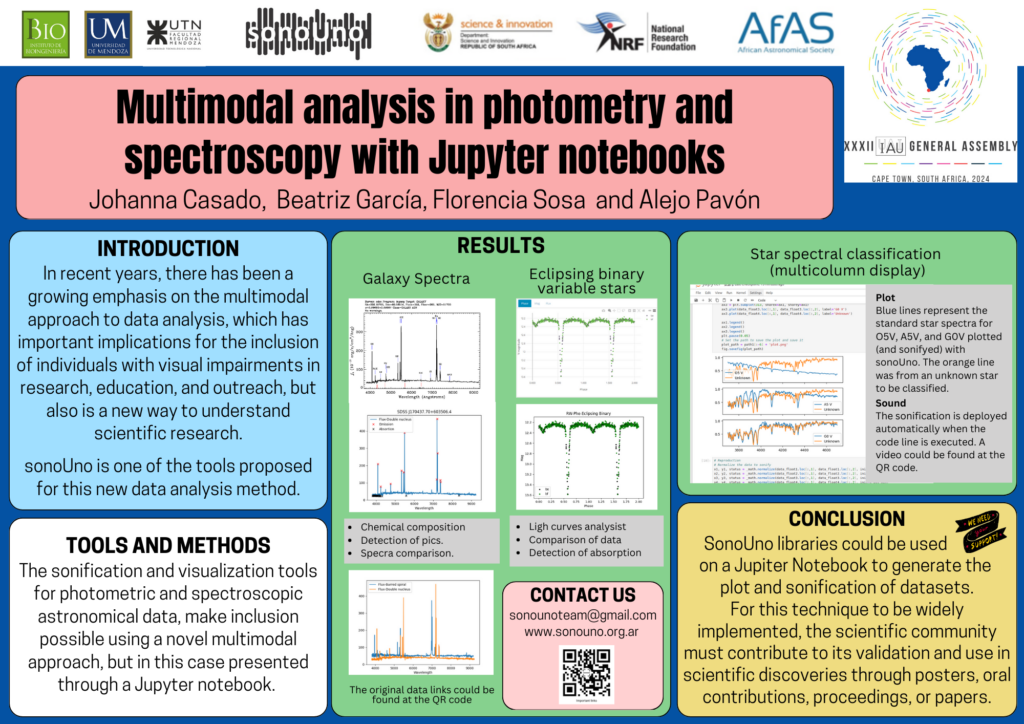
In recent years, there has been a growing emphasis on the multimodal approach to data analysis, which has important implications for the inclusion of individuals with visual impairments in research, education, and outreach. A multimodal display allows for the integration of different sensory styles when analyzing data, which can improve the overall effectiveness of data analysis. However, for this technique to be widely implemented, it is necessary for the scientific community to contribute to its validation and use in scientific discoveries. There are several tools available for sonification, but only a few of them have a graphic interface and a user-centered approach. This contribution focuses on the use of sonification for photometry and spectroscopy data, using a novel multimodal approach presented through a Jupyter notebook that follows the actual process of analysis. The object-oriented software sonoUno, which is centered on the user from the beginning, will be used, particularly its libraries, to produce the sonification and visualization of the data. The advantage of using the sonoUno libraries in a Jupyter notebook is that it enhances communication with other research groups.

Let us know your comments!