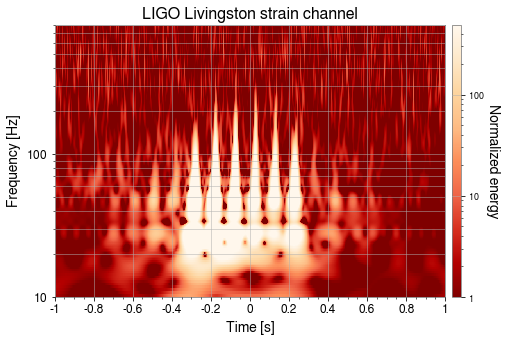
Next, you will find a video with the sonification of the previous image:
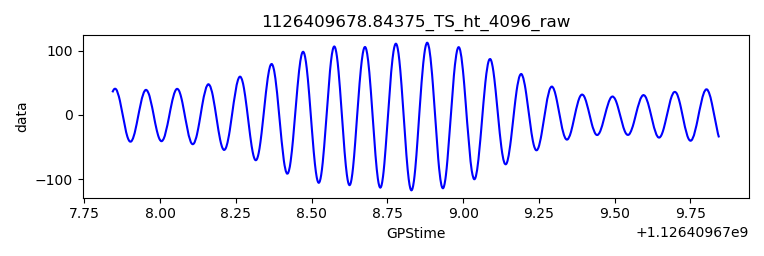
1126409678.84375_TS_ht_4096_raw data set:
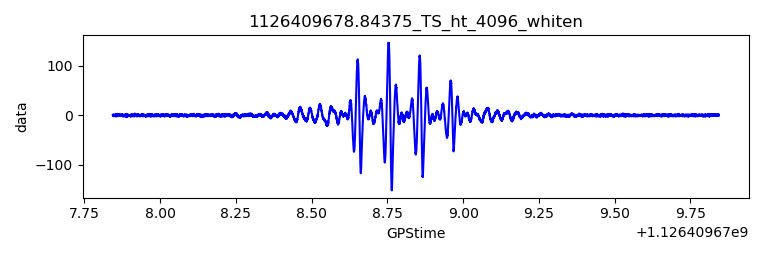
1126409678.84375_TS_ht_4096_whiten data set:
Next, you will find a video with the sonification of the previous image:
1126409678.84375_TS_ht_4096_raw data set:
1126409678.84375_TS_ht_4096_whiten data set: