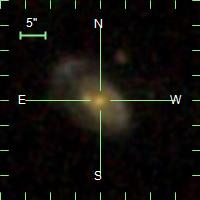
Figure 1 – Image on the galaxy SDSS J115845.43-002715.7 extracted from here.
Next, you will find a video with the sonification of the previous image produced with a beta sonoUno script:
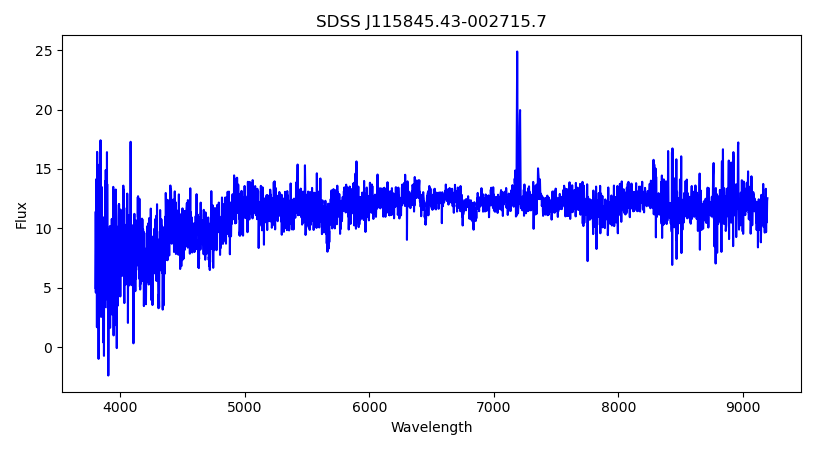
Next, the image and sound obtained in sonoUno after import the spectra data set is shown.
Figure 2 – Plot of the complete data set, the first two columns, Flux vs Wavelength.Sound 1 – Sound of the complete data set, Flux vs Wavelength. (Maximum frequency selected for this sound was 2000)
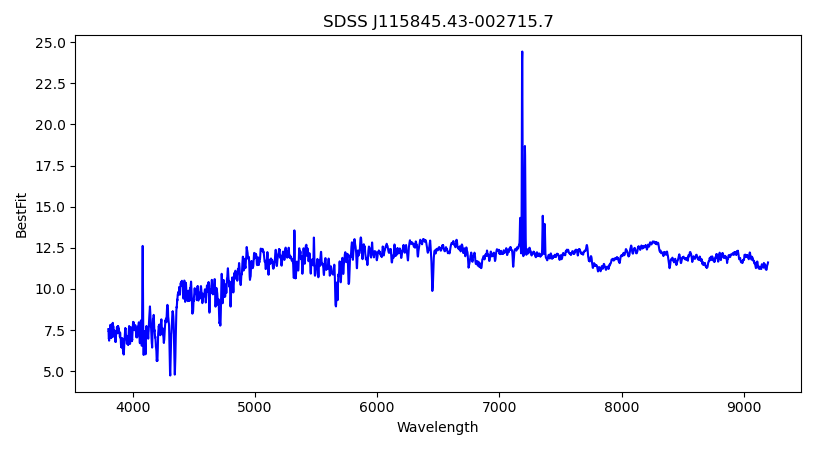
Later, in the data parameter panel, other columns where selected as y axis.
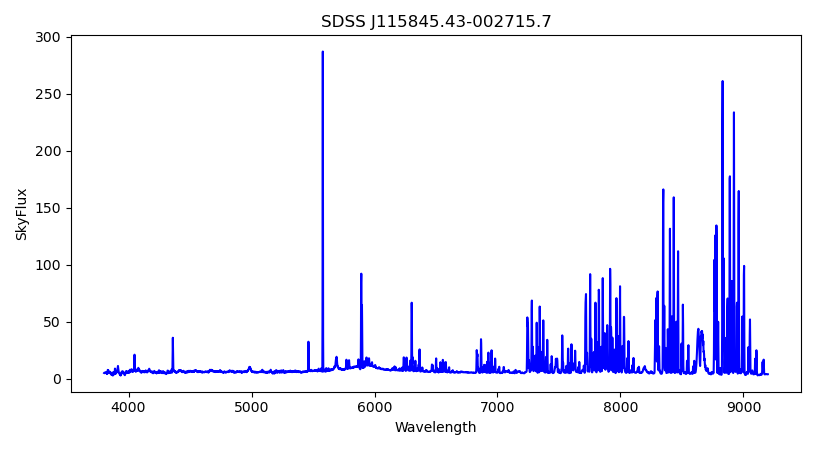
Figure 3 – Plot of the complete data set, BestFit vs Wavelength. Sound 2 – Sound of the complete data set, BestFit vs Wavelength. (Maximum frequency selected for this sound was 2000) Figure 4 – Plot of the complete data set, SkyFlux vs Wavelength. Sound 3 – Sound of the complete data set, SkyFlux vs Wavelength. (Maximum frequency selected for this sound was 2000)