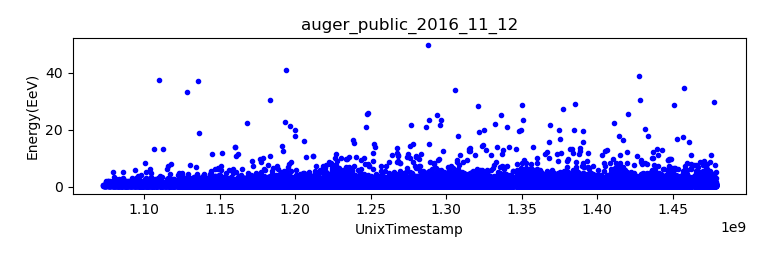
 Figure 1 – Plot obtained from sonoUno from the complete data set.
Selected range (1285973511-1294550092):
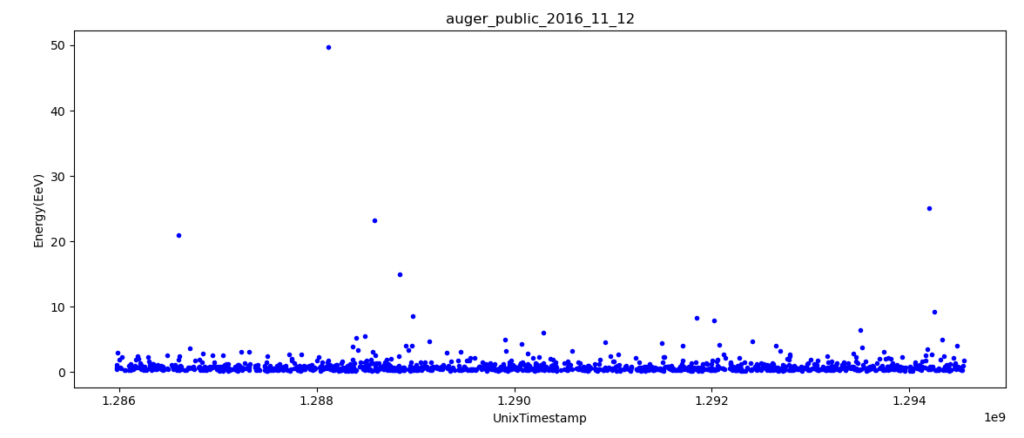 Figure 2 – Plot obtained from sonoUno, range (1285973511-1294550092)
Sound 1 – Sound obtained from sonoUno, range (1285973511-1294550092)
Figure 2 – Plot obtained from sonoUno, range (1285973511-1294550092)
Sound 1 – Sound obtained from sonoUno, range (1285973511-1294550092)
Back to gallery
Back to home