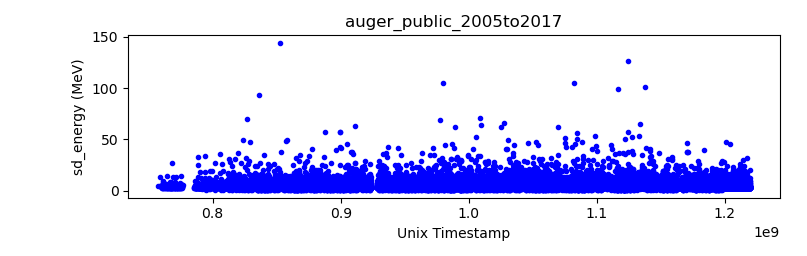
Next, two possible x axis cut are shown, first the selected range are: 1117220799 to 1135209089.
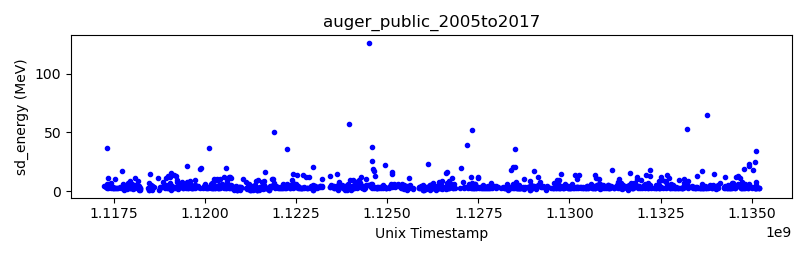
Figure 2 – Plot obtained from sonoUno, selected range (1117220799-1135209089).Sound 2 – Sound obtained from sonoUno, selected range (1117220799-1135209089).
Download data set with this selected range (1117220799-1135209089). Second, the selected range contain less data points (range: 1124471483-1125034238).
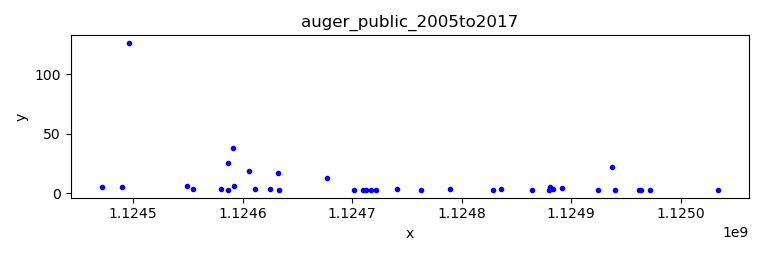
Figure 3 – Plot obtained from sonoUno with a smaller x range (1124471483-1125034238).Sound 2 – Sound obtained from sonoUno with a smaller x range (1124471483-1125034238). Video 1 – Video obtained from sonoUno with a smaller x range (1124471483-1125034238). Here the space between points could be perceived in the sound.
Download data set with this smaller x range (1124471483-1125034238).