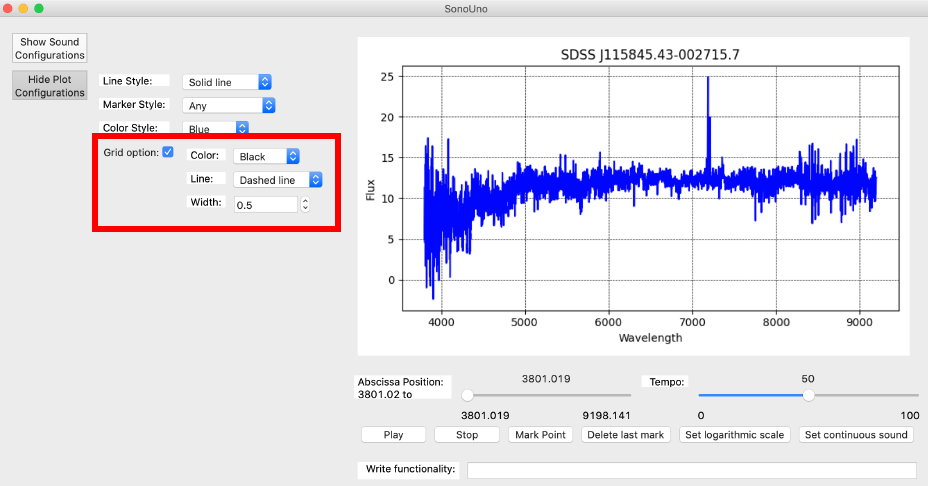
Firstly, to add the grid at the plot, the user has to check the checkbox with the grid option label. Then, the software shows three new elements that allow to configure the grid style (color, line style and width) (Image 78).
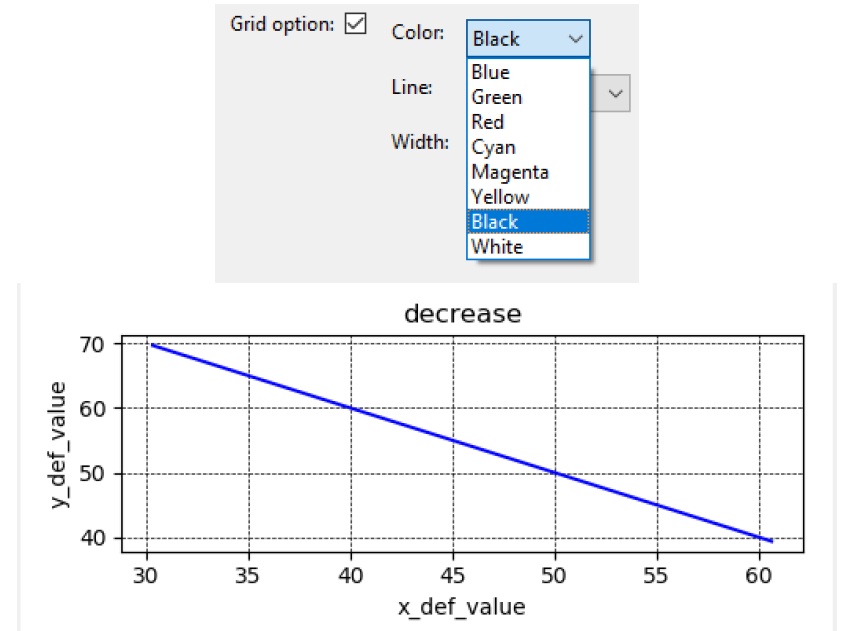
To change the color, the drop-down list placed after the color label is used, allows the user to choose between eight colors. In the Image 79 is shown the color list and the grid in the plot with black color.
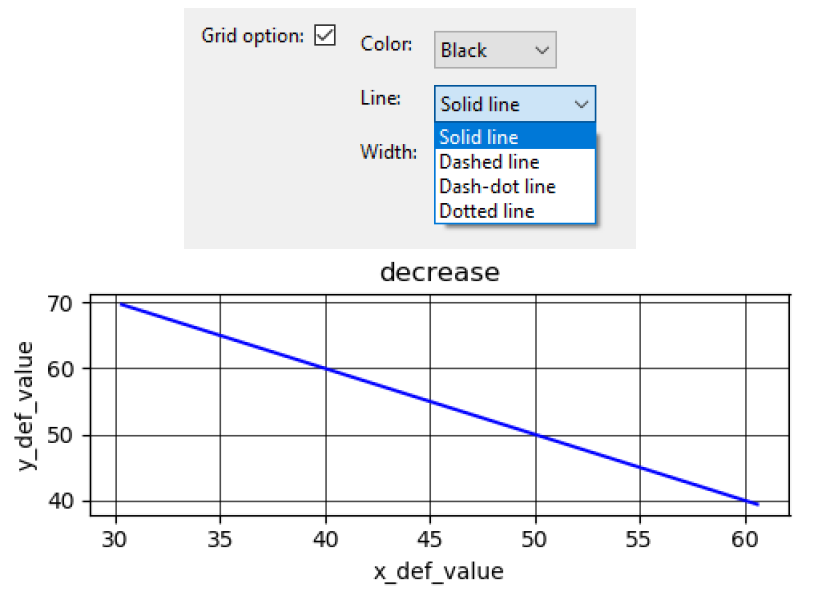
The line style option, allows the user to choose between four options: Solid, Dashed, Dash-dot and Dotted. The drop-down list is found after the line label, under the color option. In the Image 80 is shown the line style list and the continuous style is selected.
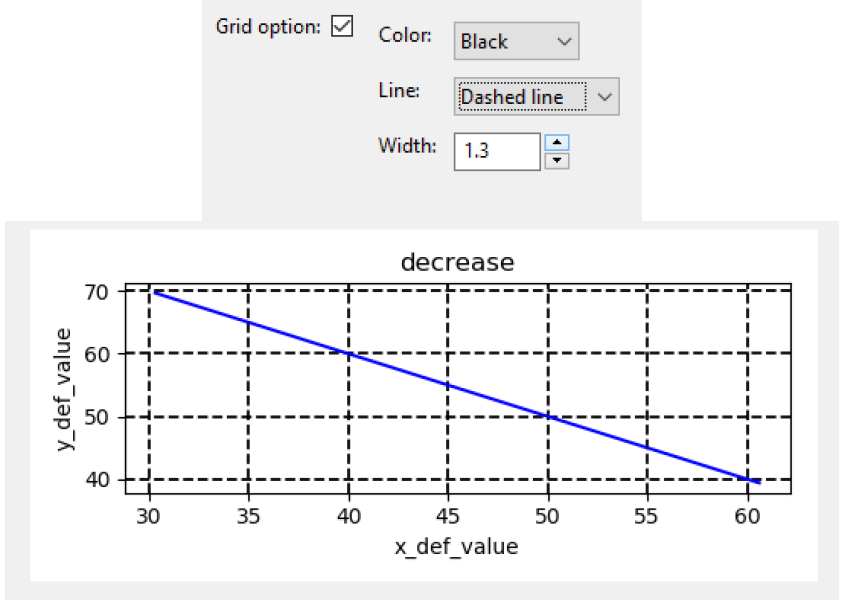
Finally, to adjust the width of the grid line, there is a number box with the width label, in which the user can type or use the arrow button to increase or decrease the value. In the Image 81 the width is changed to 1.3, the default width is 0.5.